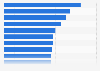
Number of visitors to SeaWorld Entertainment parks in the United States from 2010 to 2022 (in 1,000s)
Basic Account
Get to know the platform
You only have access to basic statistics.
This statistic is not included in your account.
Starter Account
The ideal entry-level account for individual users
- Instant access to 1m statistics
- Download in XLS, PDF & PNG format
- Detailed references
$199 USD / Month *
Professional Account
Full access
Business Solutions including all features.
* Prices do not include sales tax.
Other statistics that may interest you Statistics on
About the industry
10
- Premium Statistic SeaWorld's total assets in the U.S. 2010-2022
- Premium Statistic SeaWorld's headcount in the U.S. 2020-2022
- Premium Statistic SeaWorld's revenue in the U.S. 2010-2022
- Premium Statistic SeaWorld's revenue in the U.S. 2010-2022, by segment
- Premium Statistic SeaWorld's net income in the U.S. 2010-2022
- Premium Statistic Quarterly attendance to Tivoli Gardens 2019-2022
- Premium Statistic Legoland's attendance worldwide 2011-2022
- Premium Statistic Merlin Entertainments global attendance growth 2012-2022
- Premium Statistic Visitor numbers to theme park Duinrell in the Netherlands 2011-2022
- Premium Statistic Attendance at leading water parks in Europe 2023
About the region
9
- Premium Statistic Walt Disney World Hollywood Studios Florida theme park attendance 2009-2022
- Premium Statistic WNBA average regular season attendance 1997-2023
- Premium Statistic National Hockey League average regular season attendance 2008-2023
- Premium Statistic Number of visitors at conventions and exhibitions in the U.S. 2019
- Premium Statistic Generation distribution of attraction visitors in the U.S. 2018
- Premium Statistic Percentage of season pass holders/members by attraction in the U.S. 2018
- Premium Statistic Percentage of season pass holders/members in the U.S. 2015-2018
- Premium Statistic Percentage of consumers who have a season pass/membership in the U.S. 2018
- Premium Statistic Leading zoos in the U.S., by size 2018
Selected statistics
10
- Premium Statistic Most visited amusement and theme parks in North America 2022
- Premium Statistic Percentage change in amusement and theme park attendance in North America 2019-2022
- Premium Statistic Seaworld Florida theme park attendance 2009-2022
- Premium Statistic Change in attendance at amusement and theme parks in Europe 2019-2022
- Premium Statistic Seaworld California theme park attendance 2009-2022
- Basic Statistic Most visited amusement and theme parks APAC 2019-2021
- Premium Statistic Busch Gardens Tampa Bay theme park attendance 2009-2022
- Premium Statistic Most visited Latin American amusement and theme parks 2019-2022
- Premium Statistic Walt Disney World Magic Kingdom theme park attendance 2009-2022
- Premium Statistic Disneyland theme park (California) attendance 2009-2022
Other regions
10
- Premium Statistic Thermas Dos Laranjais: number of visitors 2014-2019
- Premium Statistic Attendance at the Heineken Experience in the Netherlands 2011-2020
- Premium Statistic Number of visitors to Cedar Fair parks in North America 2010-2023
- Premium Statistic Number of parks and zoos in China 2012-2022
- Premium Statistic Legoland Windsor theme park attendance in the United Kingdom (UK) 2009-2022
- Premium Statistic Leading waterparks worldwide, by size 2019
- Premium Statistic Leisure and theme park attendance in England 2017, by attraction
- Basic Statistic Russians on causes of ecological disaster on Kamchatka 2020
- Premium Statistic Number of establishments in the recreational industry Hong Kong 2010-2015
- Premium Statistic Number of establishments in arts and recreation industry Philippines 2017, by type
Related statistics
10
- Premium Statistic Alton Towers theme park attendance in the United Kingdom (UK) 2009-2022
- Premium Statistic Thorpe Park theme park attendance in the United Kingdom (UK) 2009-2022
- Premium Statistic Visitor numbers to the Euromast in Rotterdam in the Netherlands 2011-2018
- Premium Statistic Merlin Entertainments global revenue 2020-2022, by region
- Premium Statistic Merlin Entertainments global operating profit 2011-2022
- Premium Statistic Merlin Entertainments global profit before tax 2011-2022
- Premium Statistic Merlin Entertainments global revenue 2010-2022
- Premium Statistic Merlin Entertainments attendance worldwide 2011-2022
- Premium Statistic Merlin Entertainments global revenue breakdown 2022, by region
- Premium Statistic Legoland's revenue worldwide 2011-2022
Further related statistics
9
- Walt Disney World Animal Kingdom theme park attendance 2009-2022
- Universal Orlando Islands of Adventure theme park attendance 2009-2022
- Most visited art museums worldwide 2019-2023
- Number of people working in fishing and aquaculture worldwide 1995-2020
- Utilization of the worldwide fish production 2006-2020, by purpose
- Lotte World Adventure theme park attendance South Korea 2009-2022
- Ocean Park Hong Kong theme park attendance 2009-2022
- Attendance at U.S. nonprofit professional theatres 2002-2013
- Motivations for attending theater performances in the U.S. 2012
Further Content: You might find this interesting as well
Statistics
- Walt Disney World Animal Kingdom theme park attendance 2009-2022
- Universal Orlando Islands of Adventure theme park attendance 2009-2022
- Most visited art museums worldwide 2019-2023
- Number of people working in fishing and aquaculture worldwide 1995-2020
- Utilization of the worldwide fish production 2006-2020, by purpose
- Lotte World Adventure theme park attendance South Korea 2009-2022
- Ocean Park Hong Kong theme park attendance 2009-2022
- Attendance at U.S. nonprofit professional theatres 2002-2013
- Motivations for attending theater performances in the U.S. 2012
SeaWorld. (March 1, 2023). Number of visitors to SeaWorld Entertainment parks in the United States from 2010 to 2022 (in 1,000s) [Graph]. In Statista. Retrieved May 13, 2024, from https://www.statista.com/statistics/427151/number-of-visitors-to-seaworld-parks-us/
SeaWorld. "Number of visitors to SeaWorld Entertainment parks in the United States from 2010 to 2022 (in 1,000s)." Chart. March 1, 2023. Statista. Accessed May 13, 2024. https://www.statista.com/statistics/427151/number-of-visitors-to-seaworld-parks-us/
SeaWorld. (2023). Number of visitors to SeaWorld Entertainment parks in the United States from 2010 to 2022 (in 1,000s). Statista. Statista Inc.. Accessed: May 13, 2024. https://www.statista.com/statistics/427151/number-of-visitors-to-seaworld-parks-us/
SeaWorld. "Number of Visitors to Seaworld Entertainment Parks in The United States from 2010 to 2022 (in 1,000s)." Statista, Statista Inc., 1 Mar 2023, https://www.statista.com/statistics/427151/number-of-visitors-to-seaworld-parks-us/
SeaWorld, Number of visitors to SeaWorld Entertainment parks in the United States from 2010 to 2022 (in 1,000s) Statista, https://www.statista.com/statistics/427151/number-of-visitors-to-seaworld-parks-us/ (last visited May 13, 2024)
Number of visitors to SeaWorld Entertainment parks in the United States from 2010 to 2022 (in 1,000s) [Graph], SeaWorld, March 1, 2023. [Online]. Available: https://www.statista.com/statistics/427151/number-of-visitors-to-seaworld-parks-us/