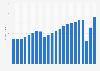
Occupancy rate of the hotel industry in the United States from 2001 to 2022
Basic Account
Get to know the platform
You only have access to basic statistics.
This statistic is not included in your account.
Starter Account
The ideal entry-level account for individual users
- Instant access to 1m statistics
- Download in XLS, PDF & PNG format
- Detailed references
$199 USD / Month *
Professional Account
Full access
Business Solutions including all features.
* Prices do not include sales tax.
Other statistics that may interest you Hotel industry in the U.S.
Industry overview
5
- Premium Statistic U.S. hotel and motel industry market size 2012-2022
- Premium Statistic Hotel room revenue in the U.S. 2019-2023
- Premium Statistic Number of hotel jobs in the U.S. 2019-2022
- Premium Statistic Hotel generated state and local tax revenue in the U.S. 2019-2023
- Basic Statistic Selected cities with the highest hotel rates in the U.S. as of September 2023
Key players
8
- Premium Statistic Most valuable hotel brands worldwide 2023, by brand value
- Premium Statistic Sales of biggest global hotel and resort companies 2023
- Premium Statistic Most positively viewed hotel brands in the U.S. Q3 2023
- Premium Statistic American Customer Satisfaction Index for hotel companies in the U.S. 2008-2023
- Premium Statistic Highest-rated luxury hotel brands in North America 2023
- Premium Statistic Highest-rated upper upscale hotel brands in North America 2023
- Premium Statistic Highest-rated upscale hotel brands in North America 2023
- Premium Statistic Highest-rated upper mid-scale hotel brands in North America 2023
Key performance indicators (KPIs)
3
Outlook
3
Further related statistics
18
- Occupancy rate of Naples, Florida in the U.S. 2013 and 2015
- Occupancy rate of hotels in South Africa by stars 2012-2022
- Occupancy rate of hotels in Kenya 2013-2023
- Colombian regions with highest hotel occupancy 2022
- Occupancy rate of hotels in Mauritius 2013-2023
- Occupancy rate of hotels in South Africa from 2000 to 2021
- Hotel occupancy in Colombia 2016-2022
- Monthly occupancy rate of hotels in Paris 2018
- Occupancy rate of hotels in Nigeria 2013-2023
- Hotel occupancy rate in South Korea 2014, by region
- Occupancy rate of hotels in the Middle East and Africa 2013, by month
- Occupancy rate of 3-star hotels in Macao 2013-2023
- Occupancy rate of Choice Hotels International in the U.S. 2017-2022, by brand
- Revenue per available room of hotels in France 2023, by city
- Features available on the mobile apps of hotels worldwide 2013
- Decline in hotel room revenue in Australia 2019-2020, by city
- Share of hotel market profits Manama in Bahrain 2018 by department
- UK survey: reasons to choose serviced apartments over hotels for city trips 2015
Further Content: You might find this interesting as well
Statistics
- Occupancy rate of Naples, Florida in the U.S. 2013 and 2015
- Occupancy rate of hotels in South Africa by stars 2012-2022
- Occupancy rate of hotels in Kenya 2013-2023
- Colombian regions with highest hotel occupancy 2022
- Occupancy rate of hotels in Mauritius 2013-2023
- Occupancy rate of hotels in South Africa from 2000 to 2021
- Hotel occupancy in Colombia 2016-2022
- Monthly occupancy rate of hotels in Paris 2018
- Occupancy rate of hotels in Nigeria 2013-2023
- Hotel occupancy rate in South Korea 2014, by region
- Occupancy rate of hotels in the Middle East and Africa 2013, by month
- Occupancy rate of 3-star hotels in Macao 2013-2023
- Occupancy rate of Choice Hotels International in the U.S. 2017-2022, by brand
- Revenue per available room of hotels in France 2023, by city
- Features available on the mobile apps of hotels worldwide 2013
- Decline in hotel room revenue in Australia 2019-2020, by city
- Share of hotel market profits Manama in Bahrain 2018 by department
- UK survey: reasons to choose serviced apartments over hotels for city trips 2015
Hospitality Net. (January 21, 2023). Occupancy rate of the hotel industry in the United States from 2001 to 2022 [Graph]. In Statista. Retrieved April 28, 2024, from https://www.statista.com/statistics/200161/us-annual-accomodation-and-lodging-occupancy-rate/
Hospitality Net. "Occupancy rate of the hotel industry in the United States from 2001 to 2022." Chart. January 21, 2023. Statista. Accessed April 28, 2024. https://www.statista.com/statistics/200161/us-annual-accomodation-and-lodging-occupancy-rate/
Hospitality Net. (2023). Occupancy rate of the hotel industry in the United States from 2001 to 2022. Statista. Statista Inc.. Accessed: April 28, 2024. https://www.statista.com/statistics/200161/us-annual-accomodation-and-lodging-occupancy-rate/
Hospitality Net. "Occupancy Rate of The Hotel Industry in The United States from 2001 to 2022." Statista, Statista Inc., 21 Jan 2023, https://www.statista.com/statistics/200161/us-annual-accomodation-and-lodging-occupancy-rate/
Hospitality Net, Occupancy rate of the hotel industry in the United States from 2001 to 2022 Statista, https://www.statista.com/statistics/200161/us-annual-accomodation-and-lodging-occupancy-rate/ (last visited April 28, 2024)
Occupancy rate of the hotel industry in the United States from 2001 to 2022 [Graph], Hospitality Net, January 21, 2023. [Online]. Available: https://www.statista.com/statistics/200161/us-annual-accomodation-and-lodging-occupancy-rate/