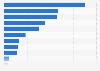
This statistic shows the annual change in silver demand worldwide in 2017 compared to 2016, by sector. It is estimated that the global silver demand for coins and bars in 2017 will be 76 million ounces less than it was in 2016.
Annual change for world silver demand in 2017 compared to 2016, by sector (in million ounces)*
Basic Account
Get to know the platform
You only have access to basic statistics.
This statistic is not included in your account.
Starter Account
The ideal entry-level account for individual users
- Instant access to 1m statistics
- Download in XLS, PDF & PNG format
- Detailed references
$199 USD / Month *
Professional Account
Full access
Business Solutions including all features.
* Prices do not include sales tax.
Other statistics that may interest you Statistics on
About the industry
10
- Premium Statistic World physical silver demand change percentage by sector 2017
- Premium Statistic World silver demand annual change by industrial application 2016
- Premium Statistic World silver demand distribution by sector 2004 and 2014
- Premium Statistic Production share of silver powder annually by major country 2011-2017
- Premium Statistic Global silver supply distribution by source 2014
- Basic Statistic Chinese total silver demand 2002-2011
- Premium Statistic Demand for silver coins and medals India 2010-2023
- Premium Statistic Demand for industrial silver in India 2012-2023
- Premium Statistic Physical silver investment in India 2011-2022
- Premium Statistic Global silver demand 2010-2023
About the region
6
- Premium Statistic Global number of announced greenfield FDI projects 2003-2022
- Basic Statistic Leading global silver producing countries 2022
- Basic Statistic Revenue of Fresnillo 2010-2022
- Basic Statistic Meta price of selected acquisitions 2022
- Premium Statistic Biomass energy industry: jobs worldwide 2022, by region
- Basic Statistic Geothermal energy: related jobs worldwide by region 2022
Selected statistics
2
Other regions
9
- Premium Statistic Machine tools: U.S. investment 2019
- Basic Statistic Silver import value in the United Kingdom (UK) 2010-2021
- Basic Statistic Public opinion on economic impact of globalization in Belgium in 2022
- Premium Statistic Production of silver in Canada by province 2022
- Premium Statistic Latin America: VC co-investment value with global investors 2017-2019
- Premium Statistic Chinese total silver supply 2002-2011
- Premium Statistic Silver supply from recycled scrap India 2012-2023
- Basic Statistic FDI inflow to agriculture, forestry, and fishery in Ghana 2009-2021
- Premium Statistic Total investment in commercial property market in Riga 2013-2019
Related statistics
10
- Premium Statistic Price of silver in India 2005-2023
- Premium Statistic Silver bullion imports volume India 2014-2023
- Premium Statistic Distribution of U.S. silver imports by country 2019-2022
- Premium Statistic Silver mine production in India 2010-2021
- Premium Statistic Fresnillo's number of employees 2010-2021
- Basic Statistic Fresnillo's number of employee fatalities 2008-2019
- Basic Statistic Gross profit of Fresnillo 2008-2018
- Premium Statistic Production value of silver in Canada by province 2018
- Basic Statistic Distribution of the global automobile demand for platinum 2017, by sector
- Premium Statistic Global gold consumption volume 2022, by leading country
Further related statistics
10
- Biofuels related jobs worldwide by region 2019
- Structure of investment portfolio of Allianz Group 2014-2023
- Number of people working in fishing and aquaculture worldwide 1995-2020
- Global oil production share 2022, by country
- Global natural gas production in oil equivalent 1998-2019
- Development of global gold stocks 2000-2015
- Number of mutual funds worldwide 2011-2014, by country
- Global pharmaceutical pipeline by therapy area 2013-2017
- Global ITO and BPO - Value of industrywide contracts 2012
- Focus areas of U.S. employer's health care strategies 2013
Further Content: You might find this interesting as well
Statistics
- Biofuels related jobs worldwide by region 2019
- Structure of investment portfolio of Allianz Group 2014-2023
- Number of people working in fishing and aquaculture worldwide 1995-2020
- Global oil production share 2022, by country
- Global natural gas production in oil equivalent 1998-2019
- Development of global gold stocks 2000-2015
- Number of mutual funds worldwide 2011-2014, by country
- Global pharmaceutical pipeline by therapy area 2013-2017
- Global ITO and BPO - Value of industrywide contracts 2012
- Focus areas of U.S. employer's health care strategies 2013
The Silver Institute. (November 15, 2017). Annual change for world silver demand in 2017 compared to 2016, by sector (in million ounces)* [Graph]. In Statista. Retrieved May 15, 2024, from https://www.statista.com/statistics/639787/silver-demand-change-worldwide-by-sector/
The Silver Institute. "Annual change for world silver demand in 2017 compared to 2016, by sector (in million ounces)*." Chart. November 15, 2017. Statista. Accessed May 15, 2024. https://www.statista.com/statistics/639787/silver-demand-change-worldwide-by-sector/
The Silver Institute. (2017). Annual change for world silver demand in 2017 compared to 2016, by sector (in million ounces)*. Statista. Statista Inc.. Accessed: May 15, 2024. https://www.statista.com/statistics/639787/silver-demand-change-worldwide-by-sector/
The Silver Institute. "Annual Change for World Silver Demand in 2017 Compared to 2016, by Sector (in Million Ounces)*." Statista, Statista Inc., 15 Nov 2017, https://www.statista.com/statistics/639787/silver-demand-change-worldwide-by-sector/
The Silver Institute, Annual change for world silver demand in 2017 compared to 2016, by sector (in million ounces)* Statista, https://www.statista.com/statistics/639787/silver-demand-change-worldwide-by-sector/ (last visited May 15, 2024)
Annual change for world silver demand in 2017 compared to 2016, by sector (in million ounces)* [Graph], The Silver Institute, November 15, 2017. [Online]. Available: https://www.statista.com/statistics/639787/silver-demand-change-worldwide-by-sector/