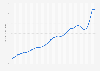
This statistic shows the expenditure on yoga equipment in the United States in 2008 and 2012. In 2012, yoga participants spent approximately 2.34 billion U.S. dollars on yoga equipment, up from around 860 million in 2008.
Expenditure on yoga equipment in the United States in 2008 and 2012 (in billion U.S. dollars)
Basic Account
Get to know the platform
You only have access to basic statistics.
This statistic is not included in your account.
Starter Account
The ideal entry-level account for individual users
- Instant access to 1m statistics
- Download in XLS, PDF & PNG format
- Detailed references
$199 USD / Month *
Professional Account
Full access
Business Solutions including all features.
* Prices do not include sales tax.
Other statistics that may interest you Statistics on
About the industry
10
- Premium Statistic Expenditure on yoga clothing in the U.S. in 2008 and 2012
- Premium Statistic Brazil: people who practice sports 2015, by sports type
- Premium Statistic Brazil: people who do sports as of September 2015, by sport & gender
- Basic Statistic Brazil: share of people who practice sports 2015, by gender
- Premium Statistic Brazil: people who do sports 2015, by age & sport
- Premium Statistic Games and toys quarterly expenditure in the United Kingdom (UK) 2014-2023
- Premium Statistic Consumption expenditure on games and hobbies per household in Denmark 2010-2022
- Premium Statistic Number of fitness and gym participants in Australia 2023, by gender
- Premium Statistic People visiting gyms, fitness clubs, sports or leisure centers Australia 2023, by age
- Premium Statistic Share of people visiting gyms, fitness clubs, sports centers Australia 2023, by age
About the region
10
- Basic Statistic Expenditure of affluent U.S. households on fees for social, recreation, health club
- Premium Statistic Gross cost of hunting licenses in the U.S. 2004-2023
- Premium Statistic Number of hunting licenses and permits in the U.S. 2004-2023
- Premium Statistic Hunting license holders in the U.S. 2004-2023
- Premium Statistic Revenue of the sports equipment industry in the U.S. 2018-2028
- Premium Statistic Sports equipment market revenue in the U.S. from 2018 to 2028, by product type
- Premium Statistic Wholesale sales (consumer segment) of home gyms in the U.S. 2007-2022
- Premium Statistic Wholesale sales (consumer segment) of ab machines in the U.S. 2007-2022
- Basic Statistic Wholesale sales (consumer segment) of free weights in the U.S. 2007-2022
- Premium Statistic Wholesale sales (consumer segment) of exercise benches in the U.S. 2007-2022
Selected statistics
4
- Premium Statistic Participants in wrestling in the U.S. from 2006 to 2017
- Basic Statistic Consumer expenditure on photo studios in the U.S. 1999-2013
- Basic Statistic Consumer expenditure on live entertainment in the U.S. 1999-2013
- Basic Statistic Global revenue of the Brunswick Corporation 2007-2023
Other regions
10
- Premium Statistic Share of the population participating in selected sports in Norway 2019
- Premium Statistic Preferred sports among the elderly in Sweden 2019
- Premium Statistic Yoga clothing market size in France 2019, by type of item
- Premium Statistic Italy: opinion on 24-hour low-cost gyms in 2017
- Premium Statistic House and garden tools: weekly UK household expenditure 2022, by gross income
- Premium Statistic Number of newly founded indoor rock climbing centers in China 2001-2018
- Basic Statistic Town centre: average spend in Great Britain 2012-2013, by reason for visit
- Premium Statistic Things on which consumers spend their disposable income in Canada 2015
- Basic Statistic Household expenditure on sound systems and speakers in Denmark 2006-2016
- Premium Statistic Sports and exercise as free time activity in England 2016, by age
Related statistics
10
- Basic Statistic Share of UK household spend on take away meals 2022, by disposable income group
- Premium Statistic Recreation and culture: weekly UK household expenditure 2021, by age
- Premium Statistic Alcohol consumed away from home: weekly UK household expenditure in 2022, by income
- Premium Statistic Take away meals: weekly UK household expenditure 2022, by gross income
- Premium Statistic Accommodation services: weekly UK household expenditure 2022, by gross income
- Premium Statistic Holiday accommodation in the UK: Weekly household expenditure 2022, by gross income
- Premium Statistic Share of UK household spend on gambling 2022, by disposable income group
- Premium Statistic Recreation and sporting services quarterly expenditure in the UK 2013-2019
- Premium Statistic Essential camping items in camping trips in the U.S. 2016
- Premium Statistic Number of hunting license holders in the U.S. 2017, by state
Further related statistics
10
- Outdoor participation in the U.S. 2021, by household income
- Income distribution of camping participants in the U.S. in 2016
- Camping expenditures for food, beverages and entertainment in North America 2014
- Employee compensation and benefits at Deutsche Bank 2006-2022
- Global net earnings of the Brunswick Corporation 2007-2023
- Overweight prevalence in England 2000-2021, by gender
- Popularity of walking for fitness in the U.S. 2010-2023
- Retail video market: consumer spending on physical video in France 2008-2022
- U.S. oil and gas industry CAPEX 2010-2022
- Most popular sporting activities in the U.S. in 2022
Further Content: You might find this interesting as well
Statistics
- Outdoor participation in the U.S. 2021, by household income
- Income distribution of camping participants in the U.S. in 2016
- Camping expenditures for food, beverages and entertainment in North America 2014
- Employee compensation and benefits at Deutsche Bank 2006-2022
- Global net earnings of the Brunswick Corporation 2007-2023
- Overweight prevalence in England 2000-2021, by gender
- Popularity of walking for fitness in the U.S. 2010-2023
- Retail video market: consumer spending on physical video in France 2008-2022
- U.S. oil and gas industry CAPEX 2010-2022
- Most popular sporting activities in the U.S. in 2022
Website (beadoyle.com). (August 23, 2013). Expenditure on yoga equipment in the United States in 2008 and 2012 (in billion U.S. dollars) [Graph]. In Statista. Retrieved May 09, 2024, from https://www.statista.com/statistics/381884/expenditure-on-yoga-equipment-in-the-us/
Website (beadoyle.com). "Expenditure on yoga equipment in the United States in 2008 and 2012 (in billion U.S. dollars)." Chart. August 23, 2013. Statista. Accessed May 09, 2024. https://www.statista.com/statistics/381884/expenditure-on-yoga-equipment-in-the-us/
Website (beadoyle.com). (2013). Expenditure on yoga equipment in the United States in 2008 and 2012 (in billion U.S. dollars). Statista. Statista Inc.. Accessed: May 09, 2024. https://www.statista.com/statistics/381884/expenditure-on-yoga-equipment-in-the-us/
Website (beadoyle.com). "Expenditure on Yoga Equipment in The United States in 2008 and 2012 (in Billion U.S. Dollars)." Statista, Statista Inc., 23 Aug 2013, https://www.statista.com/statistics/381884/expenditure-on-yoga-equipment-in-the-us/
Website (beadoyle.com), Expenditure on yoga equipment in the United States in 2008 and 2012 (in billion U.S. dollars) Statista, https://www.statista.com/statistics/381884/expenditure-on-yoga-equipment-in-the-us/ (last visited May 09, 2024)
Expenditure on yoga equipment in the United States in 2008 and 2012 (in billion U.S. dollars) [Graph], Website (beadoyle.com), August 23, 2013. [Online]. Available: https://www.statista.com/statistics/381884/expenditure-on-yoga-equipment-in-the-us/