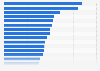
EBITDA as share of production of the manufacturing industry in Italy 2017-2023
This statistic shows the annual EBITDA as share of production of the Italian manufacturing industry from 2017 to 2018, as well as the estimated figures for the years 2019 and 2020 and the three-year-period 2021-2023. According to data provided by Prometeia, in the three years (2021-2023) the gross profit margin will be equal to 9.2 percent of the production. Over the period under consideration, the highest value was registered in 2017, when it amounted to 9.3 percent.