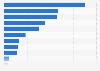
This forecast statistic shows the sales and services income of non-ferrous metal casting in Australia from 2009 to 2013, with forecasts up until 2020. By 2016, sales and services incomes of non-ferrous metal casting in Australia are projected to reach approximately 116.84 million U.S. dollars.
Sales and services income of non-ferrous metal casting (ANZSIC C2141) in Australia from 2009 to 2020 (in million U.S. dollars)
Other statistics that may interest you Statistics on
About the industry
10
- Premium Statistic Safety valves and steam traps production volume in Japan 2013-2022
- Premium Statistic Pliers production volume in Japan 2013-2022
- Premium Statistic Solenoid valves production volume in Japan 2013-2022
- Premium Statistic Saw blades stock volume in Japan 2013-2022
- Premium Statistic Solenoid valves production value in Japan 2013-2022
- Premium Statistic Saw blades production value in Japan 2013-2022
- Premium Statistic Saw blades sales value in Japan 2013-2022
- Premium Statistic Saw blades sales volume in Japan 2013-2022
- Premium Statistic Woodworking machinery blades stock volume in Japan 2013-2022
- Premium Statistic Pneumatic equipment stock volume in Japan 2013-2022
About the region
10
- Premium Statistic Industry revenue of “Metal Coating and Finishing“ in Australia 2011-2023
- Premium Statistic Industry revenue of “Sheet Metal Product Manufacturing (except Metal Structural and Container)“ in Australia 2011-2023
- Premium Statistic Industry revenue of “Architectural Aluminium Product Manufacturing“ in Australia 2011-2023
- Premium Statistic Industry revenue of “Metal Roof and Guttering Manufacturing (except Aluminium)“ in Australia 2011-2023
- Premium Statistic Industry revenue of “Prefabricated Metal Building Manufacturing“ in Australia 2011-2023
- Premium Statistic Industry revenue of “Aluminium Rolling, Drawing, Extruding“ in Australia 2011-2023
- Premium Statistic Industry revenue of “Iron Smelting and Steel Manufacturing“ in Australia 2011-2023
- Premium Statistic Industry revenue of “Structural Steel Fabricating“ in Australia 2011-2023
- Premium Statistic Forecast: sales and services income steel pipe and tube manufacture Australia 2010-2020
- Premium Statistic Forecast: sales and services income iron and steel forging Australia 2010-2020
Other regions
10
- Premium Statistic Pneumatic equipment production volume in Japan 2013-2022
- Premium Statistic Industrias CH sales revenue by country 2014-2020
- Premium Statistic Value of the metal 3D printing market worldwide by region 2019
- Premium Statistic Percentage change in metal treatment firms' production value in Italy 2015-2017
- Premium Statistic Import volume of lithium products to China 2017, by category
- Premium Statistic Imports of tube or pipe fittings - Qatar 2015
- Basic Statistic Primary metal manufacturing Capex in Canada 2010-2021
- Premium Statistic Denmark: apparent crude steel consumption per capita 2009-2021
- Premium Statistic Sweden: continuously-cast steel annual production 2006-2021
- Premium Statistic Lithuania: apparent crude steel consumption per capita 2009-2021
Related statistics
10
- Premium Statistic Forecast: sales and services income spring and wire product manufacture Australia 2010-2020
- Premium Statistic Forecast: operating revenue metal kitchen utensil manufacture China 2008-2020
- Basic Statistic Forecast: operating revenue forging manufacture China 2008-2020
- Basic Statistic Forecast: operating revenue metal structure manufacture China 2008-2020
- Premium Statistic Forecast: operating revenue metal tableware manufacture China 2008-2020
- Premium Statistic Forecast: operating revenue metal container manufacture China 2008-2020
- Premium Statistic Forecast: operating revenue cutlery manufacture China 2008-2020
- Premium Statistic Forecast: operating revenue cutting tool manufacture China 2008-2020
- Basic Statistic Forecast: operating revenue metal surface & heat treatment processing China 2008-2020
- Premium Statistic Forecast: operating revenue building decoration manufacture China 2008-2020
Further Content: You might find this interesting as well
Statistics
Statista. (February 15, 2016). Sales and services income of non-ferrous metal casting (ANZSIC C2141) in Australia from 2009 to 2020 (in million U.S. dollars) [Graph]. In Statista. Retrieved May 09, 2024, from https://www.statista.com/forecasts/424256/australia-non-ferrous-metal-casting-revenue-forecast-anzsic-c2141
Statista. "Sales and services income of non-ferrous metal casting (ANZSIC C2141) in Australia from 2009 to 2020 (in million U.S. dollars)." Chart. February 15, 2016. Statista. Accessed May 09, 2024. https://www.statista.com/forecasts/424256/australia-non-ferrous-metal-casting-revenue-forecast-anzsic-c2141
Statista. (2016). Sales and services income of non-ferrous metal casting (ANZSIC C2141) in Australia from 2009 to 2020 (in million U.S. dollars). Statista. Statista Inc.. Accessed: May 09, 2024. https://www.statista.com/forecasts/424256/australia-non-ferrous-metal-casting-revenue-forecast-anzsic-c2141
Statista. "Sales and Services Income of Non-ferrous Metal Casting (Anzsic C2141) in Australia from 2009 to 2020 (in Million U.S. Dollars)." Statista, Statista Inc., 15 Feb 2016, https://www.statista.com/forecasts/424256/australia-non-ferrous-metal-casting-revenue-forecast-anzsic-c2141
Statista, Sales and services income of non-ferrous metal casting (ANZSIC C2141) in Australia from 2009 to 2020 (in million U.S. dollars) Statista, https://www.statista.com/forecasts/424256/australia-non-ferrous-metal-casting-revenue-forecast-anzsic-c2141 (last visited May 09, 2024)
Sales and services income of non-ferrous metal casting (ANZSIC C2141) in Australia from 2009 to 2020 (in million U.S. dollars) [Graph], Statista, February 15, 2016. [Online]. Available: https://www.statista.com/forecasts/424256/australia-non-ferrous-metal-casting-revenue-forecast-anzsic-c2141