Health insurance remains a relevant and politicized topic in the United States. The number of people with health insurance in the U.S. was over 300 million in 2021, about 92 percent of the population. The health system in the country is a mix of both public and private insurers, but private is the main form of health insurance coverage among the U.S. population. In 2021, around half of the people with health insurance received private insurance through their employer, while over 34 percent were covered under the public insurance programs Medicare and Medicaid. Because the U.S. does not have universal health insurance coverage, millions of people remain uninsured every year. Public opinion on a Medicare-for-all health plan remains divided, but there is marginally more support for a single-payer system.
Health insurance in the United States - Statistics & Facts
Key insights
- Percentage of people with any health insurance in the U.S.
- 92.1%

Detailed statistics
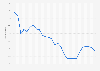
Percentage of U.S. Americans with any health insurance 1990-2022
- Percentage of U.S. population with health insurance through their employer
- 50.3%

Detailed statistics
Health insurance status of the U.S. population 2021
- Percentage of people with public health insurance in the U.S.
- 39.5%

Detailed statistics
U.S. Americans with public health insurance 1997-2022
Editor’s Picks Current statistics on this topic
Further recommended statistics
Overview
8
- Premium Statistic Percentage of U.S. Americans with any health insurance 1990-2022
- Premium Statistic U.S. Americans with health insurance 1990-2022
- Premium Statistic Health insurance status of the U.S. population 2021
- Premium Statistic U.S. Americans with public health insurance 1997-2022
- Premium Statistic U.S. household expenditure on health insurance 2007-2022
- Basic Statistic U.S. health spending per enrollee by insurance 2021 and 2022
- Basic Statistic Spending distribution of Medicare and Medicaid 2021
- Premium Statistic Views on government responsibility for provision of healthcare in the U.S. 2000-2023
Overview
-
Premium Statistic
Percentage of U.S. Americans with any health insurance 1990-2022
Percentage of U.S. Americans with any health insurance 1990-2022
Percentage of people with any health insurance in the United States from 1990 to 2022
-
Premium Statistic
U.S. Americans with health insurance 1990-2022

U.S. Americans with health insurance 1990-2022
Number of people with health insurance in the United States from 1990 to 2022 (in millions)
-
Premium Statistic
Health insurance status of the U.S. population 2021
Health insurance status of the U.S. population 2021
Health insurance status distribution of the total U.S. population in 2021
-
Premium Statistic
U.S. Americans with public health insurance 1997-2022
U.S. Americans with public health insurance 1997-2022
Share of people with public health insurance in the United States from 1997 to 2022
-
Premium Statistic
U.S. household expenditure on health insurance 2007-2022

U.S. household expenditure on health insurance 2007-2022
Average annual expenditure on health insurance per consumer unit in the United States from 2007 to 2022 (in U.S. dollars)
-
Basic Statistic
U.S. health spending per enrollee by insurance 2021 and 2022

U.S. health spending per enrollee by insurance 2021 and 2022
Health spending per enrollee in the United States in 2021 and 2022, by insurance
-
Basic Statistic
Spending distribution of Medicare and Medicaid 2021

Spending distribution of Medicare and Medicaid 2021
Distribution of Medicare and Medicaid spending in 2021*
-
Premium Statistic
Views on government responsibility for provision of healthcare in the U.S. 2000-2023

Views on government responsibility for provision of healthcare in the U.S. 2000-2023
Do you think it is the responsibility of the federal government to make sure all Americans have healthcare coverage, or is that not the responsibility of the federal government?
Private health insurance
8
- Premium Statistic Number of U.S. Americans with private health insurance in 2022, by type
- Basic Statistic Percentage of U.S. population with private health insurance coverage 1984-2019
- Premium Statistic Number of persons in the U.S. with private health insurance coverage 1984-2019
- Basic Statistic U.S. workers covered by self-funded health insurance plans 1999-2023
- Basic Statistic Health costs distribution of private insurance and out-of-pocket payments U.S. 2021
- Premium Statistic Average annual cost of health insurance deductibles in the U.S. 2010-2023
- Basic Statistic Annual premiums for employer-sponsored health insurance in 2022, by state
- Basic Statistic Employee contribution to employer-sponsored health insurance by US state 2022
Private health insurance
-
Premium Statistic
Number of U.S. Americans with private health insurance in 2022, by type

Number of U.S. Americans with private health insurance in 2022, by type
Number of people with private health insurance in the United States in 2022, by type (in millions)
-
Basic Statistic
Percentage of U.S. population with private health insurance coverage 1984-2019
Percentage of U.S. population with private health insurance coverage 1984-2019
Percentage of U.S. population with private health insurance coverage from 1984 to 2019*
-
Premium Statistic
Number of persons in the U.S. with private health insurance coverage 1984-2019

Number of persons in the U.S. with private health insurance coverage 1984-2019
Number of persons in the U.S. with private health insurance coverage from 1984 to 2019 (in millions)
-
Basic Statistic
U.S. workers covered by self-funded health insurance plans 1999-2023

U.S. workers covered by self-funded health insurance plans 1999-2023
Percentage of U.S. workers covered by self-funded health insurance plans from 1999 to 2023
-
Basic Statistic
Health costs distribution of private insurance and out-of-pocket payments U.S. 2021

Health costs distribution of private insurance and out-of-pocket payments U.S. 2021
Health spending distribution of private insurance and out-of-pocket payments in the United States in 2021
-
Premium Statistic
Average annual cost of health insurance deductibles in the U.S. 2010-2023

Average annual cost of health insurance deductibles in the U.S. 2010-2023
Average annual deductibles for employer-sponsored health insurance in the United States from 2010 to 2023 (in U.S. dollars)
-
Basic Statistic
Annual premiums for employer-sponsored health insurance in 2022, by state

Annual premiums for employer-sponsored health insurance in 2022, by state
Average annual premiums for employer-sponsored family health insurance plans in the 2022, by U.S. state
-
Basic Statistic
Employee contribution to employer-sponsored health insurance by US state 2022

Employee contribution to employer-sponsored health insurance by US state 2022
Annual average employee contribution to employer-sponsored family health insurance premiums by U.S. state in 2022 (in U.S. dollars)
Medicare
6
- Basic Statistic Percentage of U.S. Americans covered by Medicare 1990-2022
- Premium Statistic Medicare enrollment from 1966-2022, by type of beneficiary
- Basic Statistic Total Medicare spending 1970-2022
- Basic Statistic Total Medicare income 1970-2022
- Basic Statistic Medicare actual costs 2017-2021 by setting
- Basic Statistic Characteristics of the Medicare population 2020
Medicare
-
Basic Statistic
Percentage of U.S. Americans covered by Medicare 1990-2022

Percentage of U.S. Americans covered by Medicare 1990-2022
Percentage of people covered by Medicare in the United States from 1990 to 2022
-
Premium Statistic
Medicare enrollment from 1966-2022, by type of beneficiary

Medicare enrollment from 1966-2022, by type of beneficiary
Enrollment in the Medicare program from 1966 to 2022, by type of beneficiary (in millions)
-
Basic Statistic
Total Medicare spending 1970-2022

Total Medicare spending 1970-2022
Total Medicare spending from 1970 to 2022 (in billion U.S. dollars)*
-
Basic Statistic
Total Medicare income 1970-2022

Total Medicare income 1970-2022
Total Medicare income from 1970 to 2022* (in billion U.S. dollars)
-
Basic Statistic
Medicare actual costs 2017-2021 by setting

Medicare actual costs 2017-2021 by setting
Medicare actual costs by setting from 2017 to 2021 (in billion U.S. dollars)
-
Basic Statistic
Characteristics of the Medicare population 2020

Characteristics of the Medicare population 2020
Characteristics of the Medicare population in 2020
Medicaid
6
- Premium Statistic Percentage of U.S. Americans covered by Medicaid 1990-2022
- Premium Statistic Total Medicaid enrollment 1966-2022
- Premium Statistic CHIP enrollment number 1999-2022
- Premium Statistic Medicaid enrollment and expenditure by enrollment group 2021
- Basic Statistic Total Medicaid expenditure 1975-2022
- Basic Statistic Total Medicaid federal and state expenditures in the U.S. 1966-2019
Medicaid
-
Premium Statistic
Percentage of U.S. Americans covered by Medicaid 1990-2022

Percentage of U.S. Americans covered by Medicaid 1990-2022
Percentage of people covered by Medicaid in the United States from 1990 to 2022
-
Premium Statistic
Total Medicaid enrollment 1966-2022

Total Medicaid enrollment 1966-2022
Total Medicaid enrollment from 1966 to 2022 (in millions)
-
Premium Statistic
CHIP enrollment number 1999-2022

CHIP enrollment number 1999-2022
Number of CHIP enrollees from 1999 to 2022 (in million)
-
Premium Statistic
Medicaid enrollment and expenditure by enrollment group 2021

Medicaid enrollment and expenditure by enrollment group 2021
Distribution of Medicaid enrollment and expenditure in FY 2021, by enrollment group
-
Basic Statistic
Total Medicaid expenditure 1975-2022

Total Medicaid expenditure 1975-2022
Total Medicaid expenditure from 1975 to 2022 (in billion U.S. dollars)
-
Basic Statistic
Total Medicaid federal and state expenditures in the U.S. 1966-2019

Total Medicaid federal and state expenditures in the U.S. 1966-2019
Total Medicaid federal and state expenditures in the United States from 1966 to 2019 (in billion U.S. dollars)
Veterans
7
- Basic Statistic Percentage of U.S. Americans insured by military health care 1990-2022
- Basic Statistic U.S. adults insured by military health care 1990-2022
- Basic Statistic Share of U.S. WWP veterans with health care coverage as of 2022, by type of coverage
- Premium Statistic Reasons U.S. veterans with the WWP use VA as their primary care provider 2018-2020
- Premium Statistic Reasons U.S. veterans with the WWP don't use the VA health services 2021
- Basic Statistic Quality ratings of health care provided by the VA in the U.S. as of 2022
- Basic Statistic Views on VA health care compared to general health care in the U.S. as of 2022
Veterans
-
Basic Statistic
Percentage of U.S. Americans insured by military health care 1990-2022

Percentage of U.S. Americans insured by military health care 1990-2022
Percentage of people insured by military health care in the United States from 1990 to 2022
-
Basic Statistic
U.S. adults insured by military health care 1990-2022

U.S. adults insured by military health care 1990-2022
Number of people insured by military health care in the United States from 1990 to 2022 (in millions)*
-
Basic Statistic
Share of U.S. WWP veterans with health care coverage as of 2022, by type of coverage

Share of U.S. WWP veterans with health care coverage as of 2022, by type of coverage
Percentage of U.S. veteran and active service members of the Wounded Warrior Project with select types of health care coverage as of 2022*
-
Premium Statistic
Reasons U.S. veterans with the WWP use VA as their primary care provider 2018-2020

Reasons U.S. veterans with the WWP use VA as their primary care provider 2018-2020
Share of U.S. veteran and active service members of the Wounded Warrior Project who used the VA as their primary health care provider for select reasons, 2018 to 2020
-
Premium Statistic
Reasons U.S. veterans with the WWP don't use the VA health services 2021

Reasons U.S. veterans with the WWP don't use the VA health services 2021
Percentage of U.S. veteran and active service members of the Wounded Warrior Project who have never used VA health care services for select reasons in 2021*
-
Basic Statistic
Quality ratings of health care provided by the VA in the U.S. as of 2022

Quality ratings of health care provided by the VA in the U.S. as of 2022
Percentage of U.S. veterans and military households who rated the quality of health care from the Department of Veterans Affairs as excellent as of 2022
-
Basic Statistic
Views on VA health care compared to general health care in the U.S. as of 2022

Views on VA health care compared to general health care in the U.S. as of 2022
Percentage of U.S. veterans and military households who felt health care from the VA was better than what most Americans receive as of 2022
Uninsured
6
- Premium Statistic Percentage of people in the U.S. without health insurance 1997-2022
- Basic Statistic Number of people in the U.S. without health insurance 1997-2022
- Premium Statistic Share of people in the U.S. without health insurance by age 1997-2022
- Premium Statistic Percentage of people in the U.S. without health insurance by ethnicity 2010-2022
- Premium Statistic Share of total U.S. population without health insurance in 2021, by state
- Premium Statistic Percentage and rate of uninsured U.S. adult workers 2022, by industry
Uninsured
-
Premium Statistic
Percentage of people in the U.S. without health insurance 1997-2022

Percentage of people in the U.S. without health insurance 1997-2022
Percentage of people without health insurance in the United States from 1997 to 2022
-
Basic Statistic
Number of people in the U.S. without health insurance 1997-2022

Number of people in the U.S. without health insurance 1997-2022
Number of people without health insurance in the United States from 1997 to 2022 (in millions)
-
Premium Statistic
Share of people in the U.S. without health insurance by age 1997-2022

Share of people in the U.S. without health insurance by age 1997-2022
Share of people without health insurance in the United States from 1997 to 2022, by age
-
Premium Statistic
Percentage of people in the U.S. without health insurance by ethnicity 2010-2022

Percentage of people in the U.S. without health insurance by ethnicity 2010-2022
Percentage of people without health insurance in the United States from 2010 to 2022, by ethnicity
-
Premium Statistic
Share of total U.S. population without health insurance in 2021, by state

Share of total U.S. population without health insurance in 2021, by state
Percentage of the total U.S. population without health insurance in 2021, by state
-
Premium Statistic
Percentage and rate of uninsured U.S. adult workers 2022, by industry

Percentage and rate of uninsured U.S. adult workers 2022, by industry
Percentage and rate of adult workers without health insurance in the U.S. in 2022, by industry*
Leading companies
5
- Premium Statistic Largest healthcare companies in U.S. 2024, by revenue
- Premium Statistic Leading health insurance companies in the U.S. 2021, by direct premiums written
- Premium Statistic Market share of leading U.S. health insurance companies 2021, by direct premiums
- Premium Statistic Leading Medicare Advantage organizations by enrollment 2023
- Premium Statistic Operating margins of top U.S. health insurers 2015-2019
Leading companies
-
Premium Statistic
Largest healthcare companies in U.S. 2024, by revenue

Largest healthcare companies in U.S. 2024, by revenue
Largest healthcare companies in the U.S. in 2024, by revenue (in billion U.S. dollars)
-
Premium Statistic
Leading health insurance companies in the U.S. 2021, by direct premiums written

Leading health insurance companies in the U.S. 2021, by direct premiums written
Leading health insurance companies in the United States in 2021, by direct premiums written (in billion U.S. dollars)
-
Premium Statistic
Market share of leading U.S. health insurance companies 2021, by direct premiums

Market share of leading U.S. health insurance companies 2021, by direct premiums
Market share of leading health insurance companies in the United States in 2021, by direct premiums written
-
Premium Statistic
Leading Medicare Advantage organizations by enrollment 2023

Leading Medicare Advantage organizations by enrollment 2023
Leading Medicare Advantage organizations based on enrollment in 2023
-
Premium Statistic
Operating margins of top U.S. health insurers 2015-2019
Operating margins of top U.S. health insurers 2015-2019
Operating margins of leading health insurance companies in the U.S. from 2015 to 2019
Further reports
Get the best reports to understand your industry


Contact
Get in touch with us. We are happy to help.


Meredith Alda
Sales Manager– Contact (United States)
Mon - Fri, 9am - 6pm (EST)
Yolanda Mega
Operations Manager– Contact (Asia)
Mon - Fri, 9am - 5pm (SGT)
Kisara Mizuno
Senior Business Development Manager– Contact (Asia)
Mon - Fri, 10:00am - 6:00pm (JST)
Lodovica Biagi
Director of Operations– Contact (Europe)
Mon - Fri, 9:30am - 5pm (GMT)
Carolina Dulin
Group Director - LATAM– Contact (Latin America)
Mon - Fri, 9am - 6pm (EST)