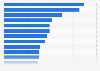
This statistic presents the frequency of adults in the United States vlogging as of November 2018. According to the findings, 84 percent of respondents reported that they never vlog themselves, while in comparison only two percent of respondents stated that they personally vlog at least once per day.
Frequency of adults in the United States vlogging as of November 2018
Basic Account
Get to know the platform
You only have access to basic statistics.
This statistic is not included in your account.
Starter Account
The ideal entry-level account for individual users
- Instant access to 1m statistics
- Download in XLS, PDF & PNG format
- Detailed references
$199 USD / Month *
Professional Account
Full access
Business Solutions including all features.
* Prices do not include sales tax.
Other statistics that may interest you Social content sharing
User behavior
6
- Basic Statistic Media usage in an online minute 2023
- Basic Statistic Average daily time spent on social media worldwide 2012-2024
- Premium Statistic Leading social media usage reasons worldwide 2023
- Premium Statistic Leading mobile-first online activities worldwide 2019
- Basic Statistic Social media platform features usage frequency in the United States 2018
- Premium Statistic U.S. & UK top dark social channels for content and information sharing 2019
Opinion sharing
8
- Premium Statistic U.S. adults who have shared an opinion piece on social media 2018
- Basic Statistic U.S. adults who have shared an opinion piece on social media 2018, by gender
- Premium Statistic U.S. adults who have shared an opinion piece on social media 2018, by age
- Premium Statistic U.S. adults unfollowing social media accounts due to an opinion piece 2018
- Premium Statistic U.S. adults unfollowing social media accounts due to an opinion piece 2018, by gender
- Premium Statistic U.S. adults unfollowing social media accounts due to an opinion piece 2018, by age
- Basic Statistic Social media: influence on political opinions of U.S. social media users 2018
- Basic Statistic Reasons U.S. Facebook users share less content on social media 2018
Photo and video sharing
8
- Basic Statistic Share of U.S. adults who are familiar with the term selfie 2018
- Basic Statistic Share of U.S. adults who have taken a selfie 2018
- Basic Statistic U.S. adults who consider acceptable to take selfies in certain situations 2018
- Basic Statistic Adults who consider acceptable to take selfies in certain situations 2018, by age
- Basic Statistic U.S. adults who consider unacceptable to take selfies in certain situations 2018
- Basic Statistic Adults who consider unacceptable to take selfies in certain situations 2018, by age
- Basic Statistic Most popular YouTube content categories 2018, by views
- Basic Statistic Most popular YouTube content categories 2018, by uploads
Mobile social
8
- Basic Statistic Global social networks ranked by number of users 2024
- Basic Statistic X (formerly Twitter) accounts with the most followers worldwide 2023
- Basic Statistic X/Twitter: most popular tweets as of 2023
- Basic Statistic Instagram accounts with the most followers worldwide 2024
- Basic Statistic Instagram: most popular posts as of 2024
- Basic Statistic Daily active users of Instagram Stories 2019
- Basic Statistic Daily active users of Snapchat 2014-2024
- Basic Statistic Daily active users of Snapchat 2014-2024, by region
Facebook
7
- Premium Statistic Facebook user engagement of leading U.S. and UK publishers 2023
- Premium Statistic Top web articles shared on Facebook from U.S. and UK publishers 2023
- Basic Statistic Leading Facebook video publishers worldwide 2019, by views
- Premium Statistic Global Facebook pages fan engagement rate 2023, by type of post
- Premium Statistic Length of top performing videos on Facebook worldwide 2017-2019, by reaction type
- Basic Statistic Share of top 100 stories on Facebook worldwide 2019, by genre
- Premium Statistic Leading Facebook usage reasons in the United States 2018
Reddit
8
- Basic Statistic Total global visitor traffic to Reddit.com 2023
- Basic Statistic Distribution of Reddit.com traffic 2023, by country
- Premium Statistic U.S. number of logged-in Reddit users 2017-2025
- Basic Statistic Reddit usage reach in the United States 2023, by gender
- Basic Statistic Reddit usage reach in the United States 2023, by age group
- Basic Statistic U.S. mobile social app user engagement growth 2018
- Premium Statistic Reddit: leading AMAs by number of upvotes 2022
- Basic Statistic Reddit: leading posts by number of upvotes 2022
Further related statistics
19
- Average number of vloggers U.S. viewers watch each week 2018, by gender
- Frequency of celebrities or influencers engaging with U.S. users on social 2018
- Bilibili video app monthly active users in China 2017-2023
- Bilibili's average DAUs Q1 2022-Q4 2023
- Bilibili video app session number in China 2017-2019
- Readiness to pay for user-generated content in Russia 2019
- Popular online streaming content types in China Q3 2019
- Most popular user-generated content types in Russia in 2019, by viewers
- U.S. online shoppers who have posted online reviews 2017, by age group
- Conversion rates of Yelp visitors to local businesses 2016
- Leading types of UGC created by U.S. online shoppers 2017
- 30-day retention rate of selected video platforms in China Q3 2022
- U.S. online shoppers who have posted online reviews 2017, by gender
- Number of Wikipedia contributors worldwide 2001-2017
- Uploading self-created content to the internet in Serbia 2009-2017
- Professional social network penetration in Belgium 2011-2017
- Professional social network penetration in North Macedonia 2013-2017
- Professional social network penetration in Norway 2011-2017
- Monthly retention rate of Sohu Video in China 2019
Further Content: You might find this interesting as well
Statistics
- Average number of vloggers U.S. viewers watch each week 2018, by gender
- Frequency of celebrities or influencers engaging with U.S. users on social 2018
- Bilibili video app monthly active users in China 2017-2023
- Bilibili's average DAUs Q1 2022-Q4 2023
- Bilibili video app session number in China 2017-2019
- Readiness to pay for user-generated content in Russia 2019
- Popular online streaming content types in China Q3 2019
- Most popular user-generated content types in Russia in 2019, by viewers
- U.S. online shoppers who have posted online reviews 2017, by age group
- Conversion rates of Yelp visitors to local businesses 2016
- Leading types of UGC created by U.S. online shoppers 2017
- 30-day retention rate of selected video platforms in China Q3 2022
- U.S. online shoppers who have posted online reviews 2017, by gender
- Number of Wikipedia contributors worldwide 2001-2017
- Uploading self-created content to the internet in Serbia 2009-2017
- Professional social network penetration in Belgium 2011-2017
- Professional social network penetration in North Macedonia 2013-2017
- Professional social network penetration in Norway 2011-2017
- Monthly retention rate of Sohu Video in China 2019
YouGov. (December 12, 2018). Frequency of adults in the United States vlogging as of November 2018 [Graph]. In Statista. Retrieved June 01, 2024, from https://www.statista.com/statistics/961147/frequency-adults-vlogging-usa/
YouGov. "Frequency of adults in the United States vlogging as of November 2018." Chart. December 12, 2018. Statista. Accessed June 01, 2024. https://www.statista.com/statistics/961147/frequency-adults-vlogging-usa/
YouGov. (2018). Frequency of adults in the United States vlogging as of November 2018. Statista. Statista Inc.. Accessed: June 01, 2024. https://www.statista.com/statistics/961147/frequency-adults-vlogging-usa/
YouGov. "Frequency of Adults in The United States Vlogging as of November 2018." Statista, Statista Inc., 12 Dec 2018, https://www.statista.com/statistics/961147/frequency-adults-vlogging-usa/
YouGov, Frequency of adults in the United States vlogging as of November 2018 Statista, https://www.statista.com/statistics/961147/frequency-adults-vlogging-usa/ (last visited June 01, 2024)
Frequency of adults in the United States vlogging as of November 2018 [Graph], YouGov, December 12, 2018. [Online]. Available: https://www.statista.com/statistics/961147/frequency-adults-vlogging-usa/