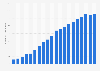
This statistic presents the forecast of earnings before interest, tax, depreciation and amortization (EBITDA) of Apple Inc from the second quarter to the fourth quarter of 2021. The EBITDA of Apple was expected to amount to approximately 39.1 billion U.S. dollars in the fourth quarter of 2021.
Forecast of EBITDA of Apple Inc from 2nd quarter 2021 to 4th quarter 2021 (in million U.S. dollars)
Basic Account
Get to know the platform
You only have access to basic statistics.
This statistic is not included in your account.
Starter Account
The ideal entry-level account for individual users
- Instant access to 1m statistics
- Download in XLS, PDF & PNG format
- Detailed references
$199 USD / Month *
Professional Account
Full access
Business Solutions including all features.
* Prices do not include sales tax.
Other statistics that may interest you Apple in the U.S.
Overview: Apple
5
- Premium Statistic Apple's revenue worldwide 2004-2023
- Premium Statistic Apple's revenue broken down by operating segments 2012-2024, by quarter
- Premium Statistic Apple's revenue broken down by geographical region 2012-2024, by quarter
- Premium Statistic Apple: expenditure on research and development 2007-2023
- Premium Statistic Number of employees of Apple 2005-2023
Overview: Apple in the U.S.
3
Segment: iPhone
8
- Premium Statistic Quarterly market share of smartphone vendors in the U.S. 2016-2024
- Premium Statistic Share of mobile operating systems in the United States 2012-2024, by month
- Premium Statistic Mobile Apple iOS version market share in the U.S. 2018-2023, by version
- Premium Statistic iPhone depreciation 5G capable in the U.S. 2023
- Premium Statistic iPhone depreciation non-5G capable in the U.S. 2023
- Premium Statistic Smartphone market share in the U.S. 2017-2024, by model
- Premium Statistic Refurbished iPhones at Apple in the U.S. 2023, by retail price
- Premium Statistic U.S. active Apple iPhone smartphone units 2008-2023
Segment: iPad
5
- Premium Statistic Market share of tablet device vendors in the United States 2020-2023
- Premium Statistic Market share of tablet operating systems in the United States 2016-2023
- Premium Statistic Tablet Apple iOS version market share in the U.S. 2018-2023, by version
- Premium Statistic Tablet ownership by brand in the U.S. 2024
- Premium Statistic People who own a tablet (e.g. iPad) in the U.S. in 2023, by age
Segment: Mac
4
- Premium Statistic PC vendor shipment share in the U.S. 2013-2023, by quarter
- Premium Statistic Market share held by PC operating systems in the U.S. 2012-2023, by month
- Premium Statistic Apple's PC unit shipment share in the U.S. 2013-2023, by quarter
- Premium Statistic Laptop ownership by brand in the U.S. 2024
Segment: Wearables & Smart home
5
- Premium Statistic Most used eHealth tracker / smart watches by brand in the U.S. 2024
- Premium Statistic Most used headphones by brand in the U.S. 2024
- Premium Statistic Apple TV active devices in the U.S. 2015-2022
- Premium Statistic Smart speaker ownership by brand in the U.S. 2024
- Premium Statistic Smart home management device ownership by brand in the U.S. 2024
Further related statistics
10
- Value of global financial assets 1990-2013
- Structure of investment portfolio of Allianz Group 2014-2023
- Rio Tinto's net income 2005-2023
- Walgreens operating income in the U.S. 2005-2023
- Value of assets managed by global ETFs 2010-2017, by region
- Number of mutual funds worldwide 2011-2014, by country
- Senior chief financial officer salary per annum in Switzerland 2023
- BayWa's revenue by segment 2010-2022
- Return on average common shareholder equity at Goldman Sachs 2009-2023
- Syngenta's sales in the crop protection segment worldwide 2013-2022
Further Content: You might find this interesting as well
Statistics
- Value of global financial assets 1990-2013
- Structure of investment portfolio of Allianz Group 2014-2023
- Rio Tinto's net income 2005-2023
- Walgreens operating income in the U.S. 2005-2023
- Value of assets managed by global ETFs 2010-2017, by region
- Number of mutual funds worldwide 2011-2014, by country
- Senior chief financial officer salary per annum in Switzerland 2023
- BayWa's revenue by segment 2010-2022
- Return on average common shareholder equity at Goldman Sachs 2009-2023
- Syngenta's sales in the crop protection segment worldwide 2013-2022
Quandl. (August 5, 2021). Forecast of EBITDA of Apple Inc from 2nd quarter 2021 to 4th quarter 2021 (in million U.S. dollars) [Graph]. In Statista. Retrieved June 10, 2024, from https://www.statista.com/statistics/632890/forecast-of-ebitda-of-apple-quarterly/
Quandl. "Forecast of EBITDA of Apple Inc from 2nd quarter 2021 to 4th quarter 2021 (in million U.S. dollars)." Chart. August 5, 2021. Statista. Accessed June 10, 2024. https://www.statista.com/statistics/632890/forecast-of-ebitda-of-apple-quarterly/
Quandl. (2021). Forecast of EBITDA of Apple Inc from 2nd quarter 2021 to 4th quarter 2021 (in million U.S. dollars). Statista. Statista Inc.. Accessed: June 10, 2024. https://www.statista.com/statistics/632890/forecast-of-ebitda-of-apple-quarterly/
Quandl. "Forecast of Ebitda of Apple Inc from 2nd Quarter 2021 to 4th Quarter 2021 (in Million U.S. Dollars)." Statista, Statista Inc., 5 Aug 2021, https://www.statista.com/statistics/632890/forecast-of-ebitda-of-apple-quarterly/
Quandl, Forecast of EBITDA of Apple Inc from 2nd quarter 2021 to 4th quarter 2021 (in million U.S. dollars) Statista, https://www.statista.com/statistics/632890/forecast-of-ebitda-of-apple-quarterly/ (last visited June 10, 2024)
Forecast of EBITDA of Apple Inc from 2nd quarter 2021 to 4th quarter 2021 (in million U.S. dollars) [Graph], Quandl, August 5, 2021. [Online]. Available: https://www.statista.com/statistics/632890/forecast-of-ebitda-of-apple-quarterly/