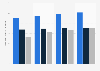
At the end of June 2022, Snapchat launched its subscription service Snapchat+ which gives users in selected markets the possibility to access premium features and functionalities. In the first week of July, in-app purchase spending on Snapchat experienced a staggering increase in the United States, with users generating approximately 3.5 million U.S. dollars in revenue for the popular social messaging app. In recent years, subscription plans for social media platforms have become increasingly popular, with the most popular subscription apps reaching 8.5 billion U.S. dollars in
Weekly in-app spending on Snapchat in the United States from June 2022 to July 2022 (in 1,000 U.S. dollars)
Basic Account
Get to know the platform
You only have access to basic statistics.
This statistic is not included in your account.
Starter Account
The ideal entry-level account for individual users
- Instant access to 1m statistics
- Download in XLS, PDF & PNG format
- Detailed references
$199 USD / Month *
Professional Account
Full access
Business Solutions including all features.
* Prices do not include sales tax.
Other statistics that may interest you Statistics on
About the industry
10
- Premium Statistic Spain: social media platforms daily usage 2023
- Basic Statistic Leading social networks in the United Kingdom (UK) 2023, by reach
- Premium Statistic Leading iPhone social media apps worldwide 2023, by downloads
- Premium Statistic Leading iPhone social media apps in the U.S. 2022, by downloads
- Premium Statistic Trending topics on Clubhouse worldwide 2021
- Premium Statistic Snapchat user ratio in the U.S. 2021, by frequency
- Premium Statistic Rate of Snapchat user activity in the U.S. 2021
- Premium Statistic TikTok user ratio in the U.S. 2021, by frequency
- Premium Statistic Rate of TikTok user activity in the U.S. 2021
About the region
10
- Premium Statistic Mobile Pinterest MAU user ratio in the U.S. 2021, by age group & gender
- Basic Statistic U.S. Gen Z & Millennials social network penetration 2019, by gender
- Premium Statistic Digital audio purchases in the U.S. 2024
- Premium Statistic U.S. Instagram users 2024, by age group
- Basic Statistic U.S. Instagram users 2024, by gender
- Premium Statistic Leading mobile game genres spending in the U.S. 2023
- Basic Statistic Pinterest user data requests by U.S. federal authorities as of H1 2023
- Basic Statistic TikTok: number of users in the United States 2023-2027
- Premium Statistic Social media audiences in the U.S. 2021
- Basic Statistic Favorite social networks of U.S. teens 2012-2023
Other regions
9
- Premium Statistic Leading Android communication apps in Italy 2022, by revenue
- Premium Statistic Leading communication apps in Google Play in Norway 2020, by DAU
- Premium Statistic Leading Android communication apps worldwide 2022, by revenue
- Premium Statistic Daily use of social media platforms in Poland 2017, by age group
- Premium Statistic Popular social commerce platform content topics in China 2019
- Premium Statistic Share of Snapchat users in France 2020, by age group and gender
- Premium Statistic Leading Android communication apps in Finland 2020, by revenue
- Premium Statistic Leading Google Play android apps by Daily active users (DAU) in Austria 2020
- Premium Statistic Leading social media apps in Google Play in Denmark 2020, by DAU
Related statistics
10
- Premium Statistic Leading Android communication apps in Switzerland 2022, by revenue
- Premium Statistic Leading Android communication apps in Great Britain 2022, by revenue
- Premium Statistic Leading Android communication apps in Germany 2022, by revenue
- Premium Statistic Leading social apps in Google Play in Norway 2020, by DAU
- Premium Statistic Daily active users (DAU) of Android communication apps in Germany 2020
- Premium Statistic Daily active users (DAU) of Android communication apps in Italy 2020
- Premium Statistic Leading Google Play apps by Daily active users (DAU) in Germany 2020
- Premium Statistic Leading Google Play android apps by Daily active users (DAU) in Switzerland 2020
- Premium Statistic Leading Google Play lifestyle app Daily active users (DAU) in Germany 2020
- Premium Statistic Leading Android social media apps in the Netherlands 2022, by revenue
Further Content: You might find this interesting as well
Sensor Tower. (July 1, 2022). Weekly in-app spending on Snapchat in the United States from June 2022 to July 2022 (in 1,000 U.S. dollars) [Graph]. In Statista. Retrieved June 01, 2024, from https://www.statista.com/statistics/1325602/snapchat-iap-spending-us/
Sensor Tower. "Weekly in-app spending on Snapchat in the United States from June 2022 to July 2022 (in 1,000 U.S. dollars)." Chart. July 1, 2022. Statista. Accessed June 01, 2024. https://www.statista.com/statistics/1325602/snapchat-iap-spending-us/
Sensor Tower. (2022). Weekly in-app spending on Snapchat in the United States from June 2022 to July 2022 (in 1,000 U.S. dollars). Statista. Statista Inc.. Accessed: June 01, 2024. https://www.statista.com/statistics/1325602/snapchat-iap-spending-us/
Sensor Tower. "Weekly In-app Spending on Snapchat in The United States from June 2022 to July 2022 (in 1,000 U.S. Dollars)." Statista, Statista Inc., 1 Jul 2022, https://www.statista.com/statistics/1325602/snapchat-iap-spending-us/
Sensor Tower, Weekly in-app spending on Snapchat in the United States from June 2022 to July 2022 (in 1,000 U.S. dollars) Statista, https://www.statista.com/statistics/1325602/snapchat-iap-spending-us/ (last visited June 01, 2024)
Weekly in-app spending on Snapchat in the United States from June 2022 to July 2022 (in 1,000 U.S. dollars) [Graph], Sensor Tower, July 1, 2022. [Online]. Available: https://www.statista.com/statistics/1325602/snapchat-iap-spending-us/